Release: Immediate
Date: 11th June 2019
PR 12/19
BA SURVEY REGISTERS TELEVISION AND RADIO AUDIENCES SHIFTS
The Broadcasting Authority has released the audience assessment survey carried out in March 2019.
For this year collection periods were changed; however each data-set is still comparable to that of the previous year for the same quarter. Respondents were also asked “what programme do you normally follow on radio?”. This is an open-ended question and is meant to be a programming aid for variation in radio programme content.
For this assessment forty daily questionnaires were compiled by the NSO giving a total sample of 1,240 respondents with the youngest being 12 year olds. Overall, this sample gives a margin of error of ±2.53%. The data was analysed demographically by gender, by age-group, and by six geographical districts.
Watching TV
As many as 274,500 persons (aged 12 years and over), or 63.4% of the population followed television regularly during March 2019. Compared to previous data, there was an insignificant decrease of 0.3% of viewers over the previous assessment period of October 2018 and a minimal increase of 0.1% over a similar period last year (February 2018 – 63.3%).
The average number of hours spent watching television amounts to 1.74hrs per viewer. This was 6 minutes less than that registered during the previous assessment in October 2018 [1.84hrs] and 4’12” lower than that of Feruary 2018 [1.81hrs]. Over the whole of the population aged 12 years and over, average viewing was at 1.72hrs which was 1’12” higher than at the previous assessment of October 2018 [1.70hrs] and 11’16” higher than that of February 2018 [1.30hrs].
Television Audiences
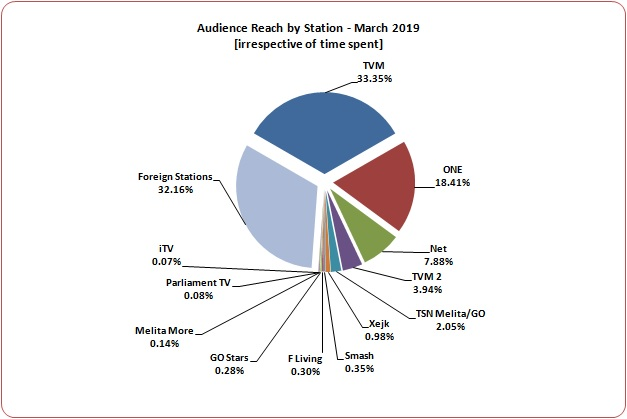
TVM has attracted the largest number of TV-viewers (33.35%) with approximately 143,000 viewers. It was followed by ONE with 18.41% (≈79,000); and Net TV with 7.88% (≈34,000). The other local TV stations’ reach ranged between 3.94% and 0.07%. Furthermore, 32.16% (≈138,000) of the population followed a foreign TV station. Analysed by demographics the viewing of local stations is the highest with those over the age of 50 years while the viewing of foreign stations is higher with those from 12 to 50 years old. As much as 40.4% of all 31-50 year olds have followed a foreign station.
On average TV viewers spent a total of 1.74hrs every day watching their favourite programme.
Respondents were asked what type of programme they like to watch on local television stations. Local & Foreign News were the most favorite programme genre [20.1%]; Local Drama programmes ranked second [14.5%]; Discussion & Current Affairs programmes ranked third [10.5%]; followed by Documentary programmes [9.6%] and Cultural/Educational programmes [9.4%]. The other categories named by respondents were as follows:
| Sports |
- |
8.6% |
| Light Entertainment/Comedy/Games |
- |
7.9% |
| Music Videos |
- |
7.7% |
| Religious |
- |
5.7% |
| Teleshopping |
- |
3.5% |
| Children's |
- |
2.6% |
Analysed by gender, male preferences exceeded female preferences mostly for sports programmes [M:42.9%; F:14.0% - ±28.9%] followed by Documentaries [M:35.9%; F: 27.9% - ±8.0%]. Preferences slightly differed between males and females for Local & Foreign News [M: 66.2%; F: 67.5% - ±1.3%] and Discussion & Current Affairs [M:34.0%; F: 36.0% - ±2.0%]. Female preferences exceed male preference for Drama by 23.3% [F:59.9%; M:36.6%]; Teleshopping by 13.3% [F:18.3%; M: 5.1%]; Light Entertainment by 13.2% [F:33.0%; M: 19.9%]; and Religious programmes by 7.1% [F:22.4%; M: 15.3%].
The most common service for watching television is that of a paid subscription [90.4%], followed by IT based services[51.0%] which include IPTV streaming [15.5%], Android box [13.7%], and Netflix [8.5%]. Only 1.3% of the population said that they have only a free-to-air service.
Radio Listenership
Radio listenership has increased by 1.0% to 242,500 persons (56.0%). During March, radio listeners spent an average of 3.02hrs every day following their favourite radio station. This was 12’36” minutes more than the assessment of October 2018 (2.81hrs) and 1’48” more over that of a similar period last year (February 2018: 2.99hrs) - an increase of 5.1% of listeners (February 2018: 50.9%)
Radio Audiences
In general radio listeners tend to follow one particular radio station. However, there are two ways of measuring radio audiences:
– by popularity or how many listeners followed each particular radio station; and
– by listenership which takes into consideration the amount of time that each listener spent following a particular station.
By popularity:
89.7 Bay has attracted the largest number of radio listeners [23.83%] with ≈60,000 listeners. This station was followed by ONE Radio with 15.81% of all listeners [≈40,000]; Vibe FM with 12.64% [≈32,000]; and Radju Malta [9.57%; ≈24,000].
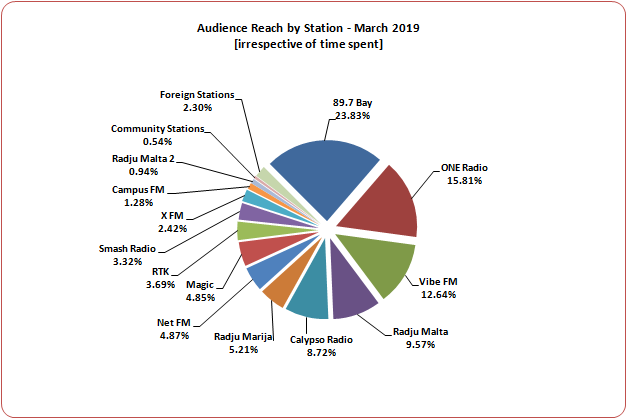
89.7 Bay was the most followed station by all those under fifty years old – with 68.5% of 12-20 year olds; 45.84% of 21-30 year olds; and about a third [30.84%] of all 31-50 year olds following this station. On the other hand, ONE Radio was the most followed station by all those over fifty years old – with just more than a quarter [25.37%] of all 51-70 year olds and just above a third of all 71+ year olds [31.19%] following this station.
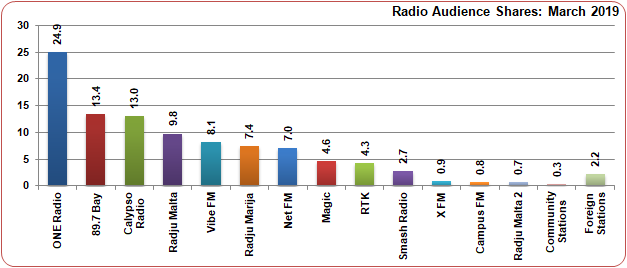
By Listenership:
Bearing in mind the amount of time that listeners spent following their favourite programme on radio, ONE Radio ranked first with 24.9% of all audiences, followed by 89.7 Bay [13.4%]; Calypso Radio [13.0%]; Radju Malta [9.8%]; Vibe FM [8.1%]; Radju Marija [7.4%]; Net FM [7.0%]; Magic Malta [4.6; %]; RTK [4.3%]; Smash Radio [2.7%], while the rest had less than 1% of all audiences.
Respondents were asked what radio programmes they normally follow. Radio broadcasts can be split into five segments: Morning Drive (6:00-10:00); Daytime (10:00-15:00); Afternoon Drive (15:00-19:00); Evening (19:00-24:00); and Overnight broadcasts (24:00-6:00). Responses were analysed by these five main time brackets and the amount of responses for each bracket practically coincided with radio audiences within these brackets.
Analysed by gender, there were noticable differences between gender: Males exceeded females [4.19%] for morning drive programmes; females exceeded males [5.77%] for daytime programmes; males exceeded females [3.05%] for the afternoon drive; and females exceeded males [4.05%] for overnight programmes. The difference for generic programmes was minimal – by 1.82% [Males: 29.61; Females: 27.79%].
The full version of the results of the survey can be downloaded from the Authority’s website.
Mario Axiak, M.B.A (Maastricht)
Head, Research & Communications
11th June 2019
Click here for Press Release 12/19
Click here for the full Assessment of March 2019
Click here for previous assessments